
In our experience, there is a great deal of confusing information about business valuation. Most business owners have heard about the values that some other business owners may have received for their business. Drawing conclusion from rumors, casual and incomplete information can be very dangerous.
Recent studies indicate that nearly 80% of business owners are relying on the value of their business to fund retirement. Those same studies indicate that fewer than 30% have a plan to make that happen – or have any idea what their business is really worth.
![]() When a business buyer looks at business valuation, regardless of the specific methodology they may choose to use, their process involves assessing the likely future cash flows of the business and the likelihood of them actually being realized in the future.. Business owners often ask us if a business buyer will focus almost completely on the current year or will “average” their analysis over a certain timeframe such as three years. The reality is that a business buyer is not interested in the current year or the past three years. The most important year to them is NEXT year and the year after that. The past is only important in helping predict the future. As a side note, the answer is that a buyer will be more interested in the most recent data. If data over a longer period of time reflects a negative trend, that will temper their view of the current data. Said another way, they are likely to essentially take the lesser of the current data or the recent three-year data.
When a business buyer looks at business valuation, regardless of the specific methodology they may choose to use, their process involves assessing the likely future cash flows of the business and the likelihood of them actually being realized in the future.. Business owners often ask us if a business buyer will focus almost completely on the current year or will “average” their analysis over a certain timeframe such as three years. The reality is that a business buyer is not interested in the current year or the past three years. The most important year to them is NEXT year and the year after that. The past is only important in helping predict the future. As a side note, the answer is that a buyer will be more interested in the most recent data. If data over a longer period of time reflects a negative trend, that will temper their view of the current data. Said another way, they are likely to essentially take the lesser of the current data or the recent three-year data.
In order to discuss business valuation, we have to first discuss transaction structures. Different transaction structures are likely to impact business valuations. Although there are a wide range of variations, most transactions are asset purchase transactions, structured on a cash-free, debt-free basis. That means that at closing, the seller retains all cash in the business and pays off all debt (equipment financing, term debt, line of credit) with the business sale proceeds. The buyer receives all the operating assets of the business, including non-cash working capital. The buyer receives both accounts receivable and accounts payable.
The asset purchase agreement will lay out a target amount of working capital, or at least a formula to determine it. If the actual working capital (mostly accounts receivable minus accounts payable) is greater than the target working capital, there is an adjustment to increase the purchase price. If the actual working capital is less than the target working capital, there is an adjustment down in the purchase price. There are many different ways in practice to determine target working capital. This is a particularly important issue to seasonal businesses like most landscaping businesses. It is important to consider this issue when evaluating a purchase offer since two different possible buyers may treat it very differently. It is unwise to evaluate or enter into a letter of intent that does not address the details of the target working capital. This is not a detail to defer evaluating until later in the process.
Two other transaction terms require some discussion as to their impact in valuation. The first is seller financing. In general, the more seller financing that is provided, the higher the purchase price should be. Sellers usually say they would prefer little or no seller financing. That may or may not make sense as the potential sales price may increase in lockstep with the amount of seller financing provided. Said a bit more directly, the seller financing might be gravy you can’t get any other way. As a practical matter, many business sales agreements provide for between 20% and 30% or more in seller financing.
The other transaction terms that bear addressing at this point are “earn-outs” and “claw-backs”. These are purchase price adjustments that kick in if certain things happen post-closing. An earn-out is an additional amount of purchase price that is to be paid if the business achieves certain agreed goals after closing. A claw-back is a downward adjustment in the purchase price that happens if certain agreed events occur after closing. Claw-backs are often limited to the amount of seller financing, but this is not always the case.
Earn-outs and claw-backs are often used to address differences of opinion about business valuation. In a sense, the seller is guaranteeing the performance of the business after closing. Both give the possibility that a business seller will realize more from the business than they would have received otherwise. Obviously, there is risk in using these approaches and careful crafting and monitoring is required.
One often hears of “rules of thumb” for business valuation for various types of businesses. Sometimes, these are based on a multiple of revenue. Other times they are based on a multiple of EBITDA or free cash flow. Free cash flow is usually defined as EBITDA minus capital expenditures plus or minus change in working capital. There are also sometimes rules of thumb based on a multiple of revenues. Except in a few very specific circumstances, those rules of thumb based on revenues are not very helpful.
While a multiple of EBITDA is a commonly used metric, free cash flow is often used and makes a great deal of sense. When using EBITDA as a multiple in valuation analysis, higher capital expenditures or higher working capital requirements are factors that will move the valuation to the lower end of the valuation range.
Ultimately, valuation will be impacted by many factors that come in to play in a buyer’s evaluation of the future cash flows expected from the business.
For most businesses, there is a range of likely valuations. In addition to the transaction terms discussion above, there are a variety of factors that will determine where a specific business will be valued on the range of potential values. The following table identifies characteristics which may tend to raise or lower a particular business’s valuation.
| Impact on Valuation Range | ||
| Target Characteristics | Lower | Higher |
| Profitability & Growth Prospects | Uncertain | Strong |
| Recurring revenue | Lower percentage | Higher percentage |
| Management team strength | Weak | Strong |
| Size of the business | Smaller | Larger |
| Location | Less desirable market, rural | Desirable market, urban/suburban |
| Competitive Environment | High | Low |
| Capex Requirements | High | Low |
| Working capital requirements | High | Low |
| Owner-centricity | High | Low |
| Workforce quality & access to labor | Low | High |
| Customer concentrations | High | Low |
| Customer characteristics | Less Positive | Positive |
| Compliance (immigration, environmental, safety, etc.) | Poor compliance | Strong Compliance |
| Financial Records | Strong accounting and systems | Strong accounting & systems |
We have reviewed all of that information to temper what we have gathered from our study of valuation trends. Valuation is not a precise process and will always be impacted by the perspectives and circumstances of a buyer. Business sellers are often surprised by the valuations placed on their businesses by potential buyers. In most cases, the answers to why valuations fall short of expectations can be found in this table.
Study Process
There are several databases of business sale transaction data maintained by various groups. For this study, we have used two databases, Pratt’s Stat’s, owned and maintained by Business Valuation Resources, and PeerComps, owned and maintained by GCF Valuation.
Pratt’s Stats is a robust online database, that reports that it has extensive financial details on 26,000+ acquired private companies, with up to 149 data points for each transaction. Each transaction includes detailed data necessary in applying the market approach to business valuation, deriving a selling price, benchmarking performance, or performing a fairness opinion analysis.
Pratt’s Stats generally obtains transactions for the database from business brokers and M&A advisors. Before a transaction is included in Pratt’s Stats, each transaction is carefully reviewed by Business Valuations Resources personnel who maintain the database.
Since 1988, PeerComps has gathered data on over 7,0000 transactions from SBA lenders. PeerComps obtains the data in its database from participating financial institutions which provide SBA financing in connection with merger & acquisition transactions.
Both of these databases are searchable by subscribers and provide various analysis tools.
Transaction data in these databases can be hard to evaluate for several reasons. The reporting of sale transactions is limited to voluntary reporting by transaction participants. Many buyers prefer not to call attention to their acquisitions and certainly are hesitant to permit disclosure of transaction details. As a result, the data is far less complete and accurate than real estate comps.
The data is organized by SIC code or NAICS code. Unfortunately, the applicable codes for landscaping services are very broad. They include both landscape maintenance and construction as well as lawn care (fertilization and weed control) and all for both residential and commercial businesses. The limited information provided along with the data makes it very difficult to narrow the selection of comparable transactions. As a result, an inherent weakness of this study is that it includes a wide range of businesses – residential, commercial, lawn care, landscape maintenance, irrigation, etc. Our results will take that fact into consideration. You will not be able to value your business based on the information we can provide here.
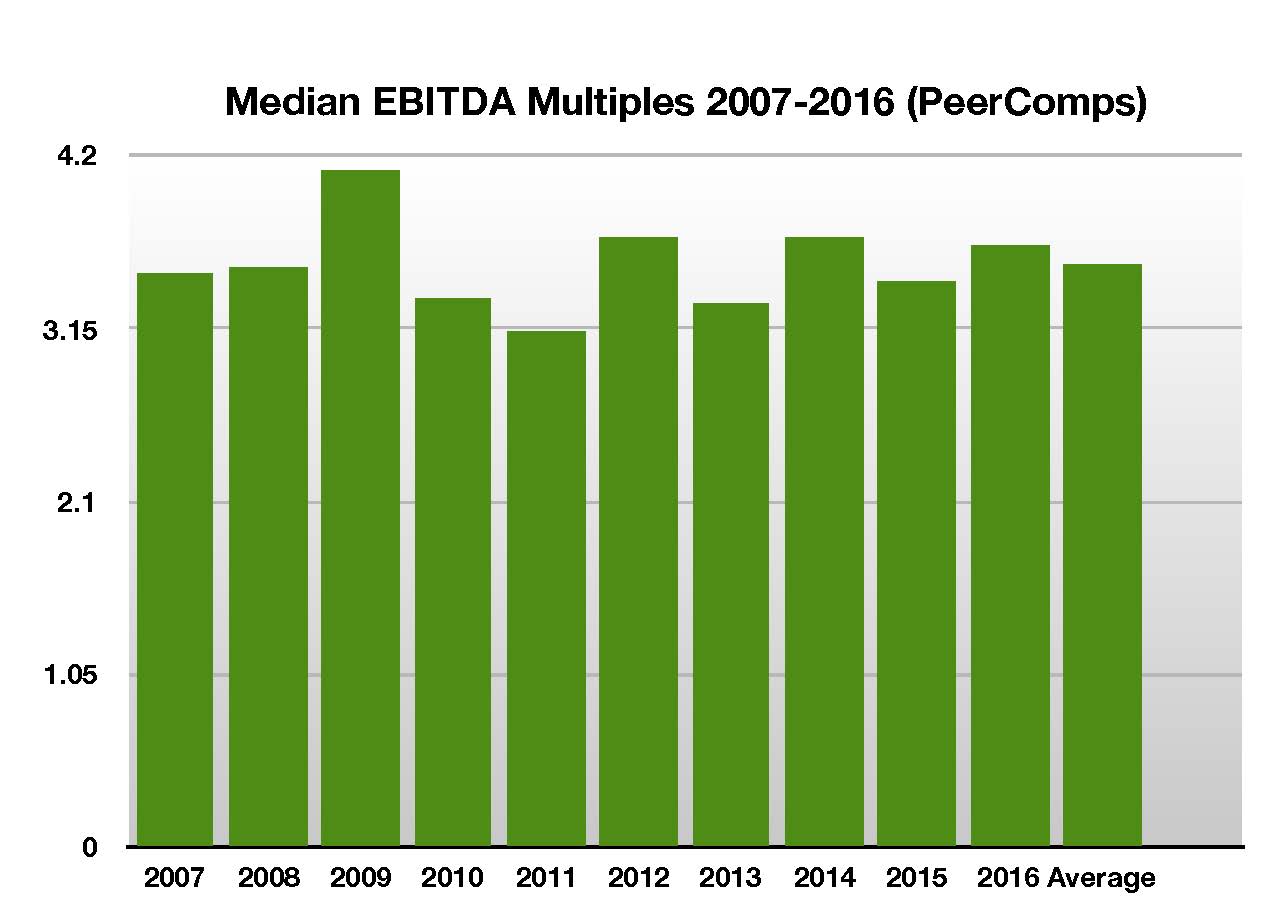
Because Pratt’s Stats is the larger and better known database, we used it for primary research for our study. We reviewed information in PeerComps to confirm the conclusions that we reached.
Our basic process for the study was as follows:
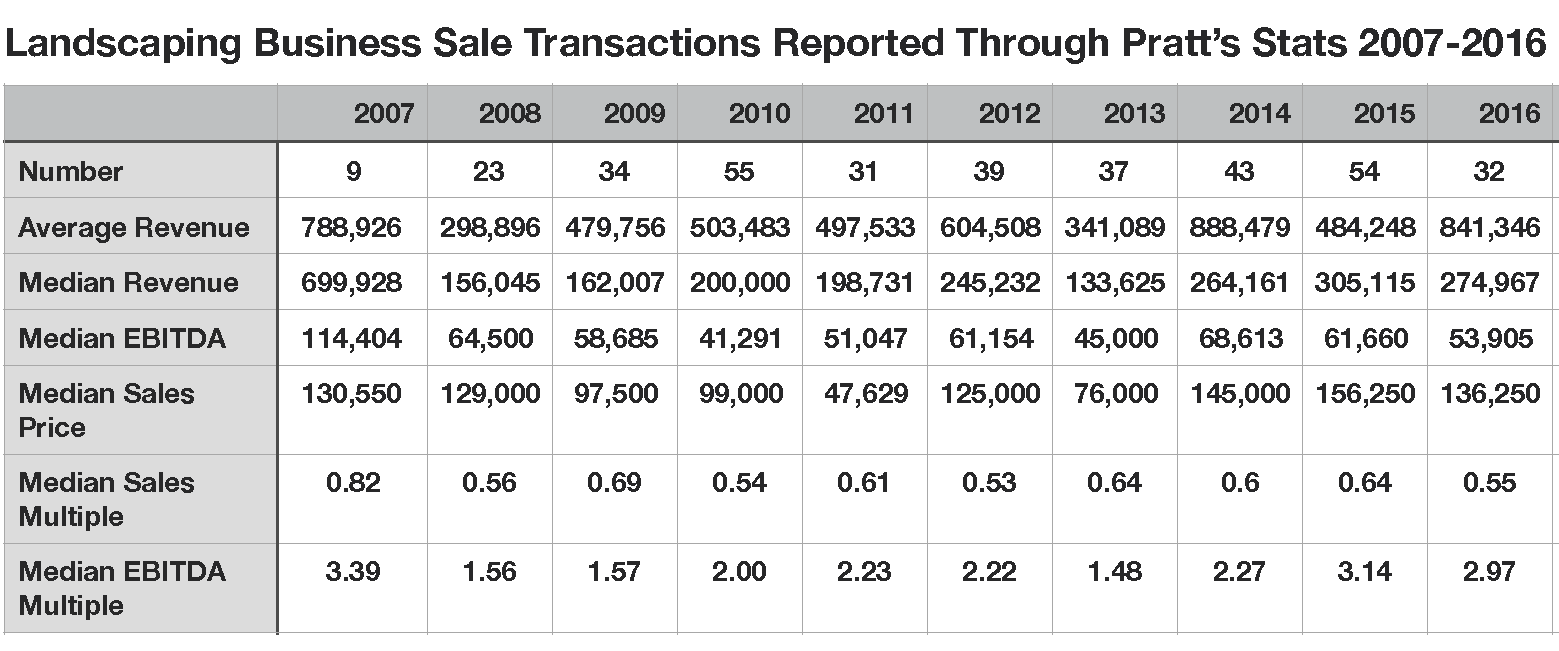
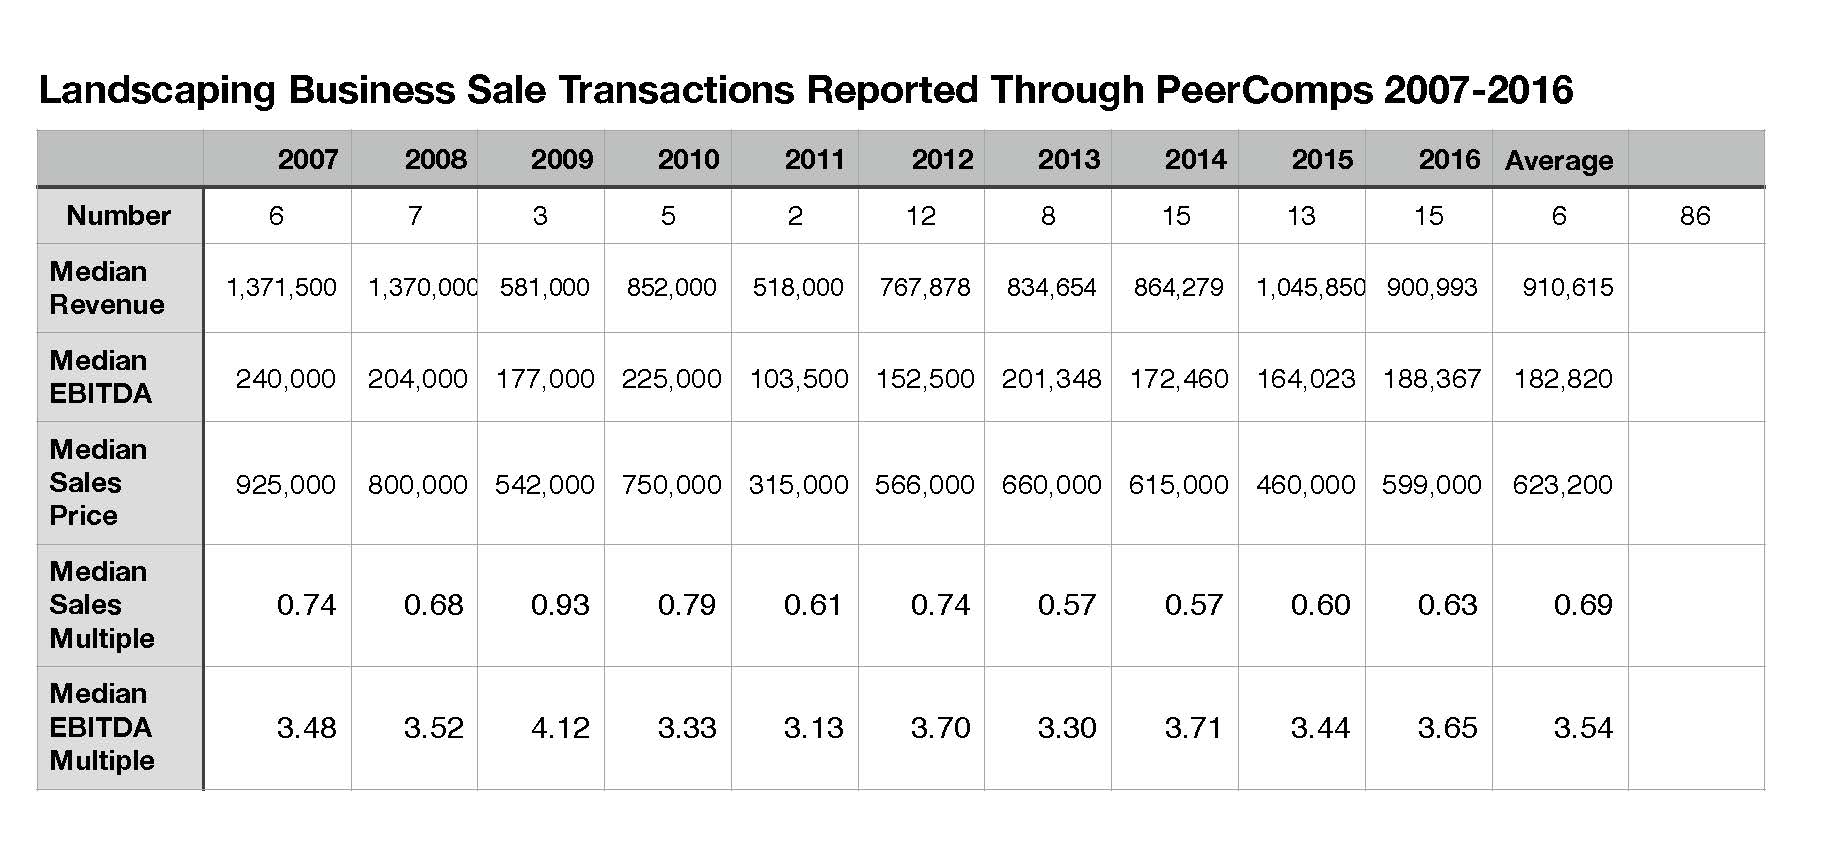
- We researched the databases and found 357 transactions reported during the 10-year period 2007-2016 in Pratt’s Stats and 86 transactions in PeerComps for landscape services.
- We divided the data by transaction year.
- We calculated the revenue multiple and EBITDA multiple for each transaction so identified.
- For each year, we reviewed the underlying data and eliminated obvious outliers, typically caused by very low EBITDA. An EBITDA multiple is not considered meaningful in such circumstances.
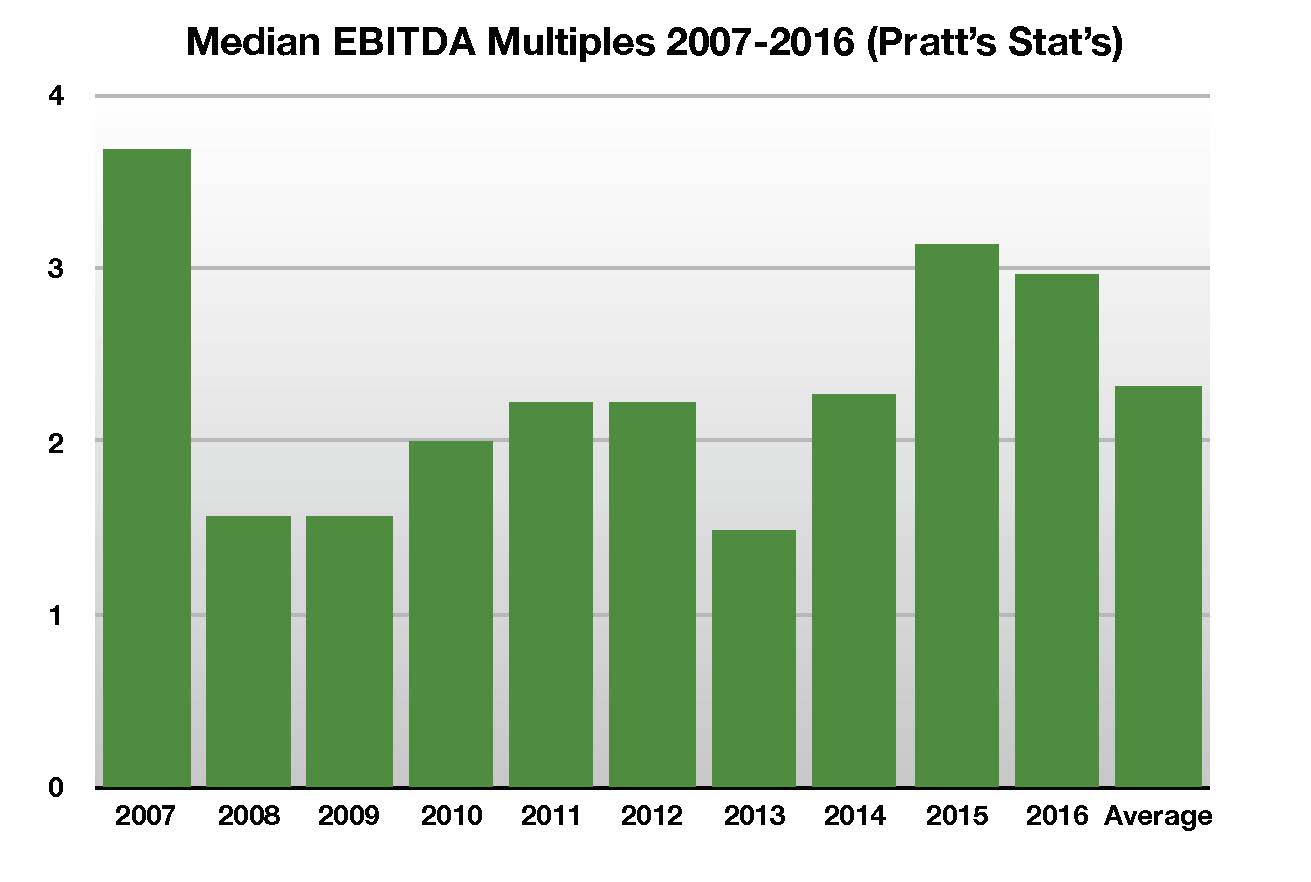
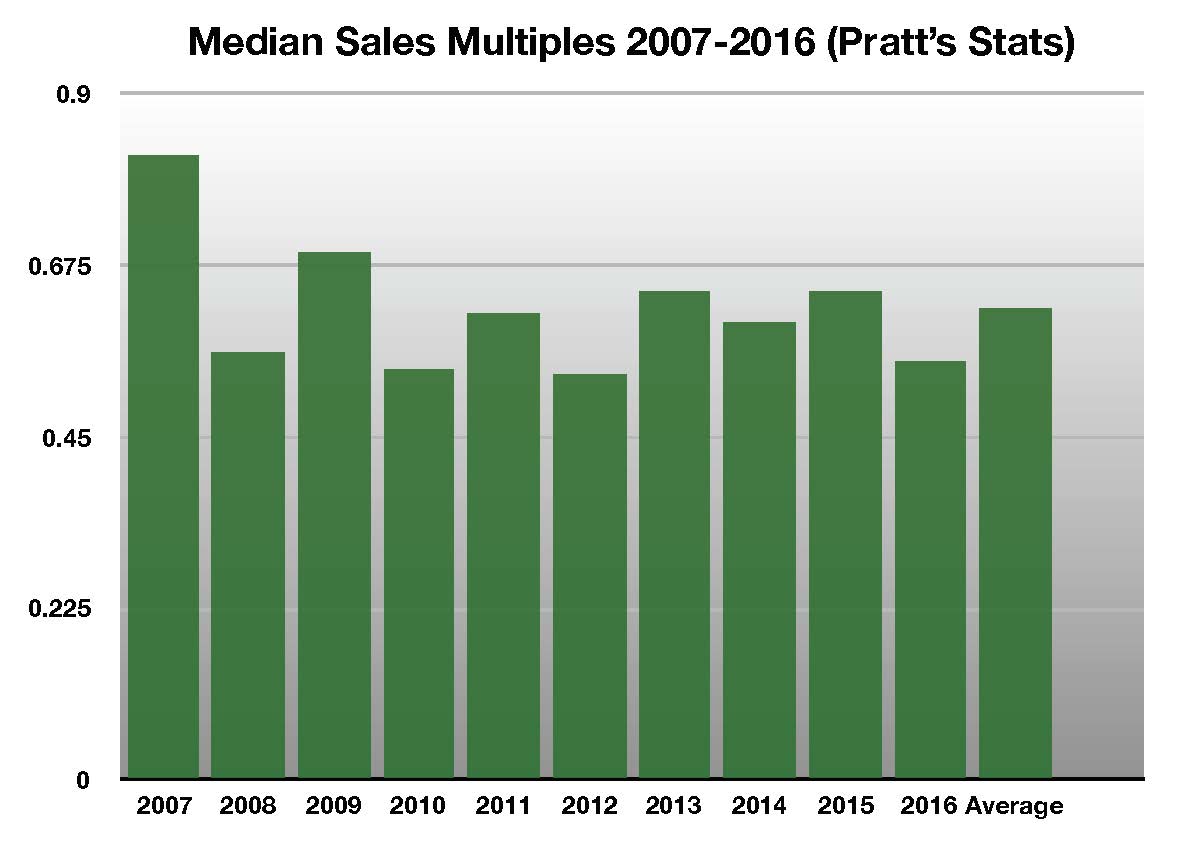
- We then calculated the median revenue multiple and the median EBITDA multiple for each year.
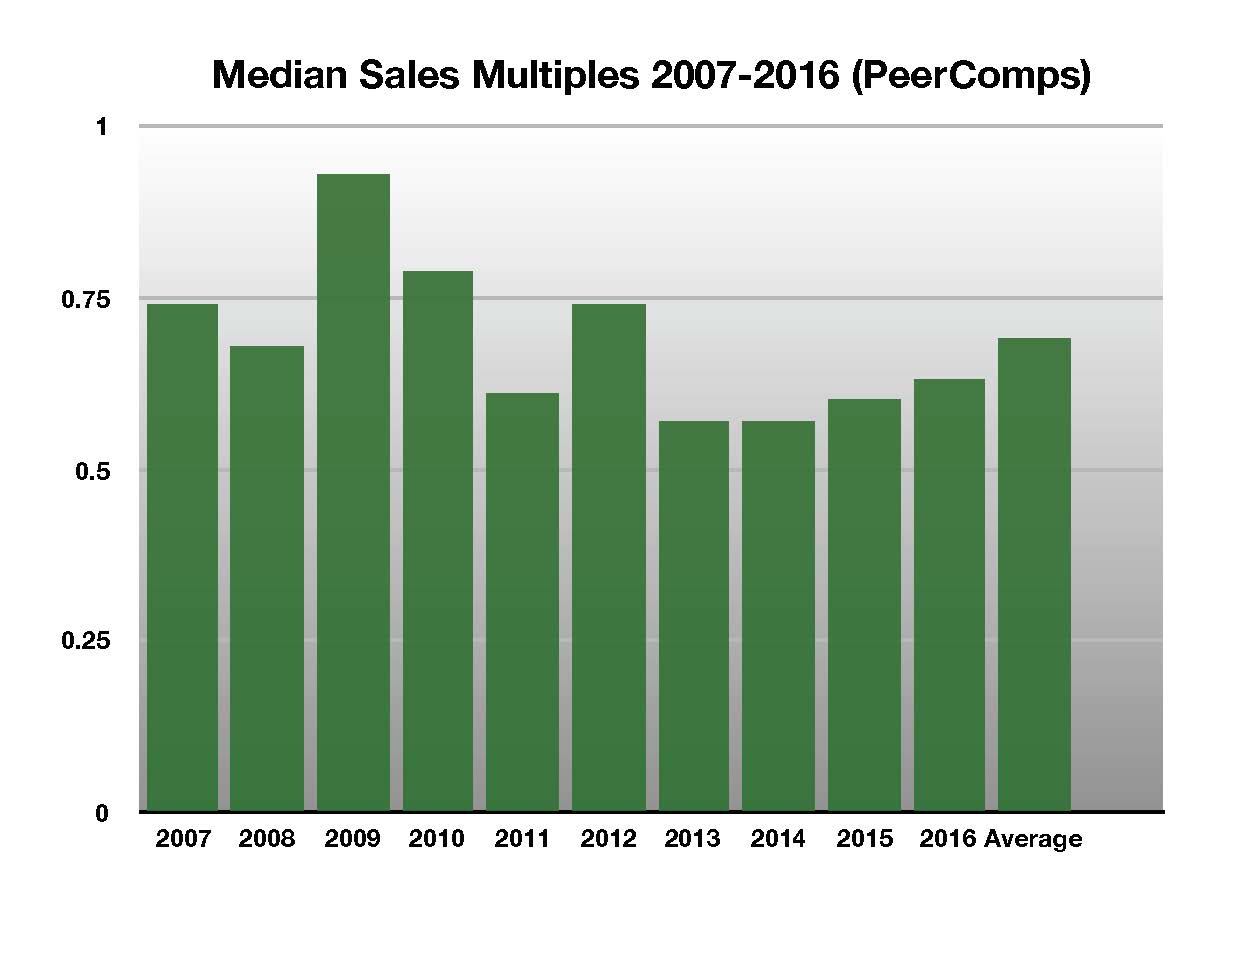
The data for each of the databases is graphically illustrated in the following charts:
Conclusions
A review of these charts and the underlying data discloses that valuations of landscape industry businesses have operated in a relatively narrow band during the past ten years. That supports what many of us in the industry have observed. That is an interesting phenomenon since that ten-year period contains some years with relatively robust activity and others in which activity was limited. It includes all of the Great Recession.
We tend to believe that the narrow differences in the valuations area caused by several factors, including the very nature of the landscape business. Most of this period includes the Great Recession and the period immediately following it. The harsh reality of the recession has been indelibly imprinted in the minds of many business owners and financial institutions. Even as the industry has grown more prosperous and one might expect to see an uptick. Financial institutions and private equity investors alike have been careful not to permit valuations to get out of hand or rise precipitously.
In most cases, we expect this scenario to continue into the future for at least several more years.
How does a business owner make the best of this scenario? If a business owner’s objective is to get the highest possible valuation on his or her business, we suggest that the owner review the table of target characteristics and impact on valuation earlier in this report. By focusing on those characteristics, the business owner can have a dramatic impact on valuation by both “moving the multiple” and generating higher cash flow from the business.